|
You can create a Gantt chart from an existing project. Creating a project from an approved detailed quote is a great way to get your project stages and tasks into your project with just a few clicks. To create a Gantt chart:
|
 |
|
What do you see on the tasks?
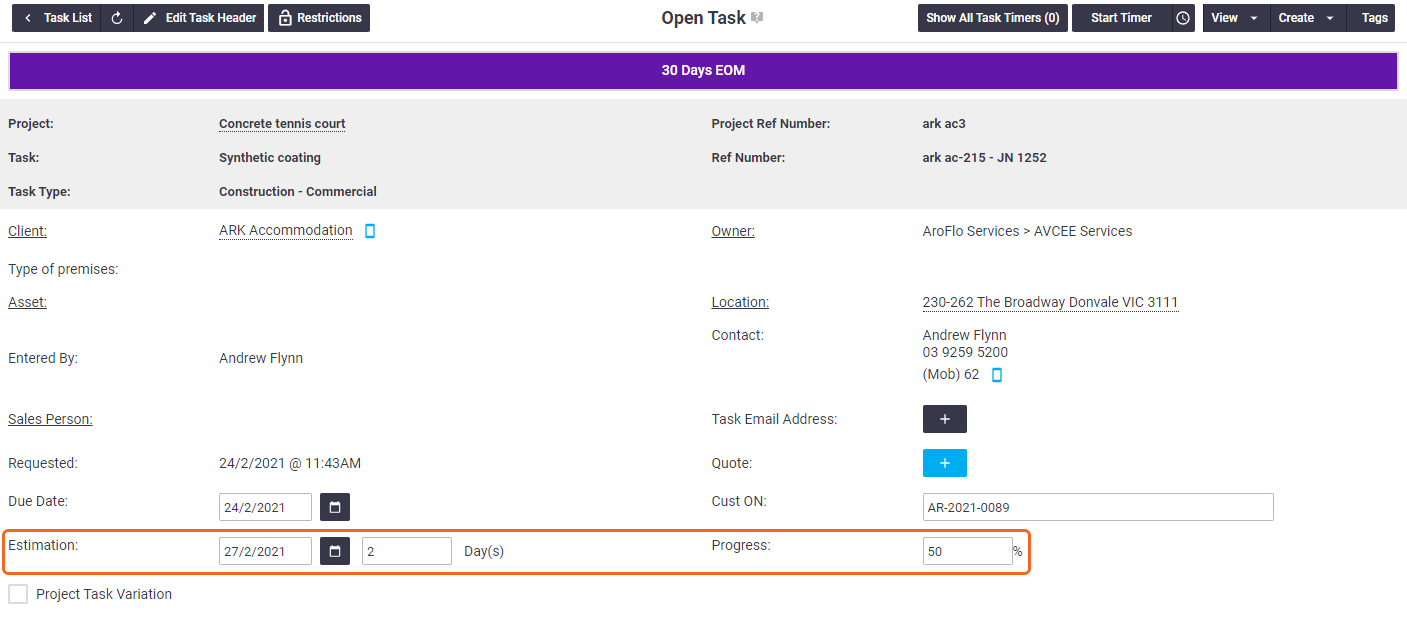
As soon as you've created your Gantt Chart, any tasks included in the project receive three new fields: Estimation (start date and duration) and Progress. These fields interact with the Gantt chart, and vice versa. When you've made a change to either the fields or the Gantt chart, click Refresh (top left of Gantt chart) to update the chart.
Gantt chart elements
Click the links below for an introduction to the elements of the Gantt chart.
Top navigation
Explanation of options
| Element | Description |
|---|---|
| Refresh button | Refreshes the Gantt chart if you've added, deleted or altered stages, tasks or milestones. |
| Adjust by Dependencies |
Adjusts the placement of tasks and schedules on the timeline, and the dates in the Start Time column, when you have linked one stage or task to another (or to several others). This ensures the stages, tasks and schedules display in the right sequence. You can also click this button if you have adjusted the dates or durations of your tasks via the Gantt chart task bars or the AroFlo Calendar. See Set Dependencies & Milestones for more information. |
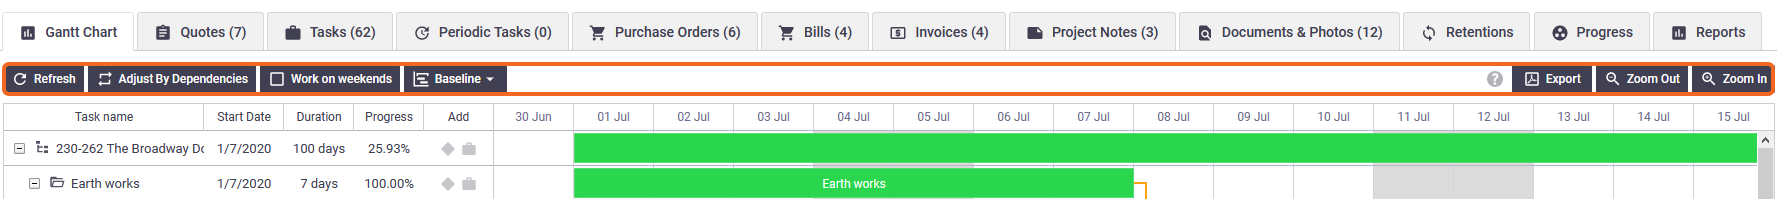
| Work on Weekends |
Include weekend days in the project duration. In the image above, this box is unchecked and the weekend days appear as grey columns, which means that they are not counted in the project duration, even though task bars can extend across them. |
| Baseline |
Lets you create a snapshot of your original timeline, so you can see at a glance if things are getting off track. Switch the baseline on or off, display only the baseline, or delete it. See Create a Baseline for more information. |
| Export | Creates a PDF, image (.PNG) or .CSV copy of your Gantt chart. See Export a Gantt Chart for more information. |
| Zoom Out | Increases the time intervals shown on the timeline, e.g from days to weeks, weeks to months. |
| Zoom In | Decreases the time intervals shown on the timeline, e.g. from months to weeks, weeks to days. |
Left-hand navigation
Explanation of columns
| Element | Description |
|---|---|
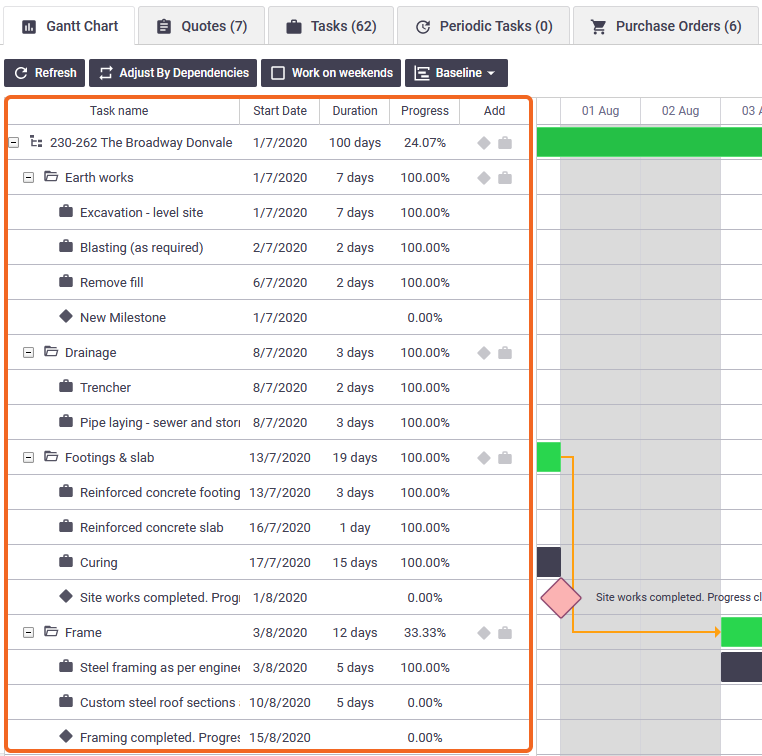
| Task name | The name of the project stage or task. The first item on the list is the project name. Click the plus or minus to expand or minimise a stage. Show this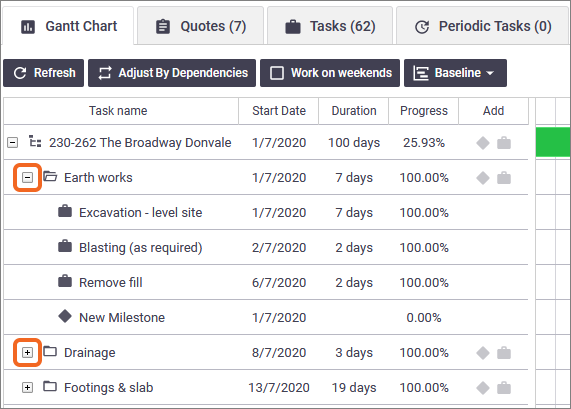 |
| Start date | The date on which the stage or task should start. See Adjust task bars for information on changing the start date. More about the Start dateThe start date on a:
Click the date to zoom straight to that date on the timeline. This can be handy when you have projects with very long durations. |
| Duration | The number of days the project, stage or task is expected to take to complete. More about the DurationThe duration of a:
|
| Progress | An indication of what percentage of the task, stage or project has been completed. The Progress percentage is controlled by the slider on each task bar. See Schedule Project Tasks for more information.  |
| Add | Add a Milestone ( |
 ) or a task (
 ) within a stage, or directly under the project.
 Timeline area
Explanation of elements
| Element | Description |
|---|---|
| Dates | The dates across the top of the timeline can be displayed in days, weeks, months, quarters or years. Use the Zoom Out and Zoom In buttons to change this. |
| Timeline area (grid) | The area that displays project stages and tasks in a sequential format. Click and drag the timeline area to the left or right to move to a different date, or use the vertical or horizontal scroll bars. You can also click on the task date in the left-hand navigation to quickly jump to that date. |
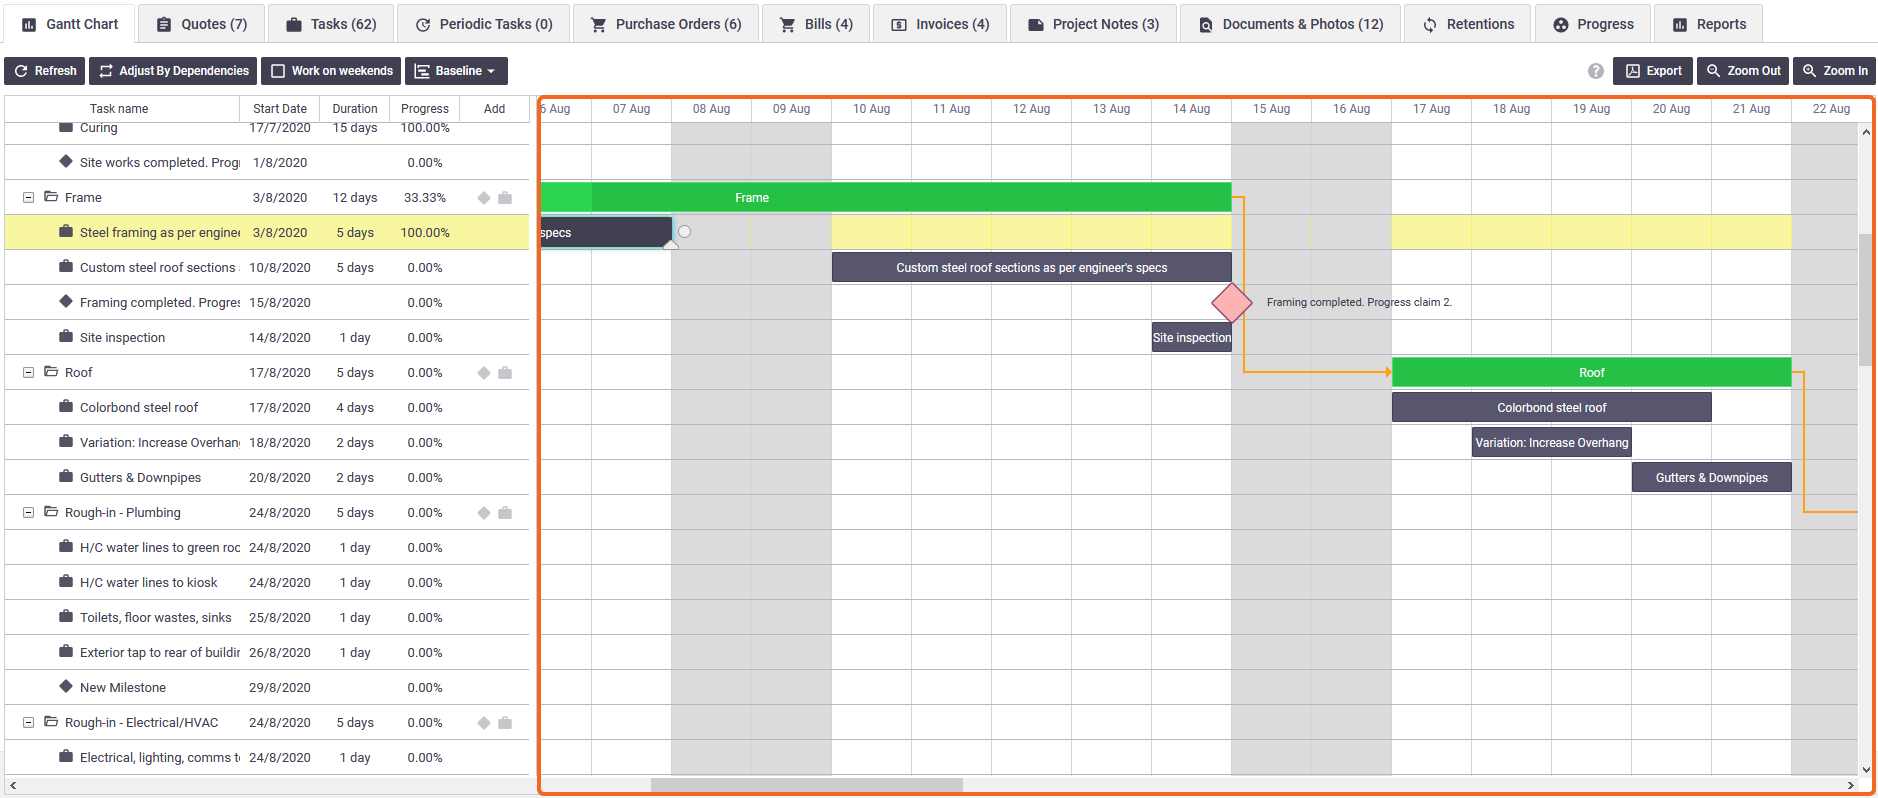
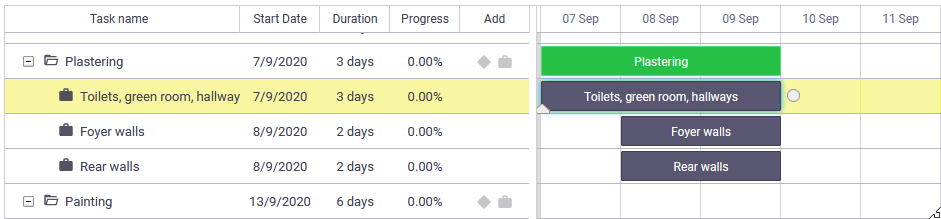
| Stage (green) bar | Project stage. Stage start and end dates cannot be manipulated on the stage bar. As you manipulate project tasks (see next row), the stage bars adjust automatically. |
| Task (dark grey) bar | Project task. As you place the task bars on the timeline, the project stage bar expands or contracts to cover all the tasks in that stage. See Adjust task bars for more information. |
Vertical shaded (light grey) columns |
By default, your Gantt chart will have the weekend days shaded when you're zoomed into the daily or weekly view. Although stage or task bars may extend across weekends, weekend days are not counted in the project duration unless you click the Work on Weekends checkbox. This removes the vertical shading from weekend days and counts weekends in the project duration. |
| Yellow bar | The selected stage or task. |
| Orange connectors | Dependencies. These are links between stages or tasks that indicate that a stage or task can't start until an earlier stage or task has been completed. See Set Dependencies & Milestones for more information. |
| Pink diamond | A milestone. This is a marker to show at a glance where key project events sit on the timeline. See Set Dependencies & Milestones for more information. |
Task Bars
The Task Bars are the key element on the Gantt Chart that allow you to see at a glance how your project is tracking. This section explains more about how to use the task bars and access the additional information and options that sit behind them.
Adjust task bars
You can adjust the order of tasks within a stage by clicking and dragging the task name in the left-hand navigation. Changes will be reflected on the timeline.
You can adjust the start date of a task on the timeline by clicking and dragging a task bar to where you want it, or by double-clicking the task bar and selecting a date from the Task Start field.
Task Start field

You can adjust the duration of a task either by double-clicking the task bar and adding days to the Task Duration, or by adjusting the task bars as follows:
- Click the task bar you want to adjust.
- Hover over the left or right end of a task bar until a double-pointed arrow appears.
- Click the double-pointed arrow and drag to the right or left until the task bar covers the period you need.
Task Duration
Adjusting the task start date or duration in this way will update the Estimation fields in the Task Worksheet. These fields only appear on project tasks once a Gantt chart has been created for the project.
Estimation fields
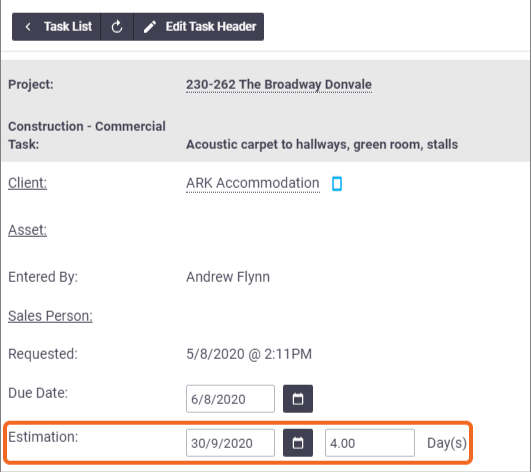
If you update the Estimation fields in the Task Worksheet, the changes will be reflected on the Gantt chart; if you don't see the changes, click Refresh on the top left of the timeline.
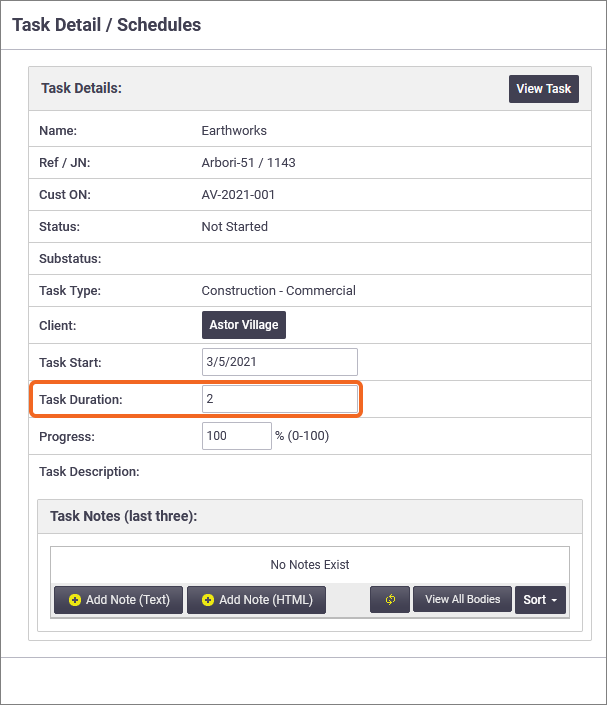
Task Detail / Schedules window
You can access the Task Detail / Schedules window by double-clicking on any task bar within your Gantt Chart.
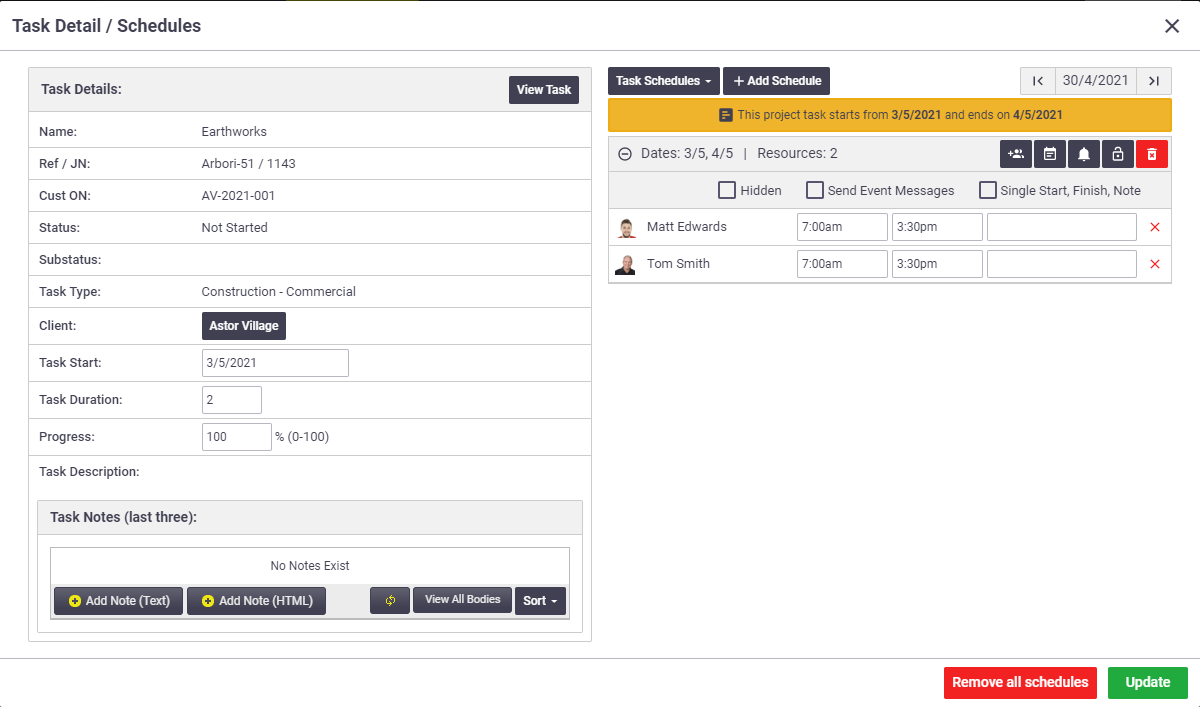
Task Details areaThe Task Details area provides an overview of the key task details, as well as handy access to the task itself, the client card, and any notes that have been recorded on the task:
|
Task Schedules areaThe Task Schedules area lets you schedule project tasks, just like you would on the Calendar, or remove schedules:
|
||||||||||||||||||||||||||||||||||||||||||
Task Schedules areaThe Task Schedules area lets you schedule project tasks, just like you would on the Calendar, or remove schedules:
|
What to do next
Once you've created your Gantt chart and moved all the task bars to where you need them on your timeline, the next thing to do is Set Dependencies and Milestones, to highlight key points in the project.