AroFlo's standard reports can easily be customised to include a variety of fields, filters and options.
Create or edit categories (optional)
Reports can easily be organised into categories by first creating the categories you need and then selecting the appropriate category when saving your custom report. This is useful if you're planning on creating several custom reports.
Do I have to create categories?
No. If you don't create categories, your custom reports will be stored under the Standard Reports category (folder), visible underneath the Custom Reports header. You can choose to create categories at a later stage and drag reports into categories (folders) using the  (two lines) next to the name of the report.
- Create a category - Click Add Category, enter a category name and click Done.
-
Create a sub category - Hover over a category, click
 (green plus icon), enter the sub-category name and click Done.
 -
Edit a category name - Hover over a category, click
 (edit icon), edit as required and click Done.
 -
Delete a category - Hover over a category, click
 (X icon) and click OK.
You can only delete a category once you have removed all reports from it, either by moving them to another category or by deleting them.
Customise a report
When you open a standard report, access the Customise menu at the top right.
The Customise menu provides four tabs:
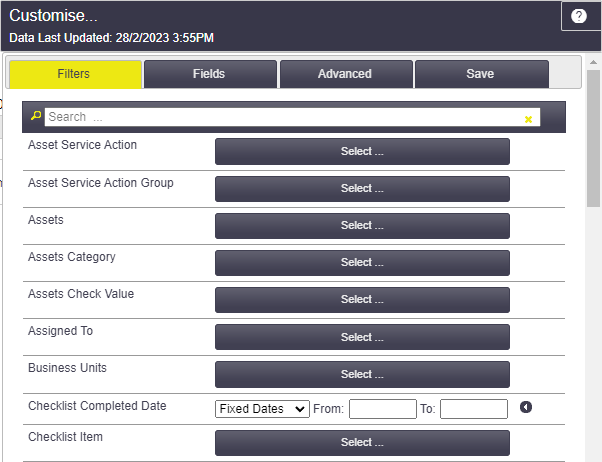
Filters
|
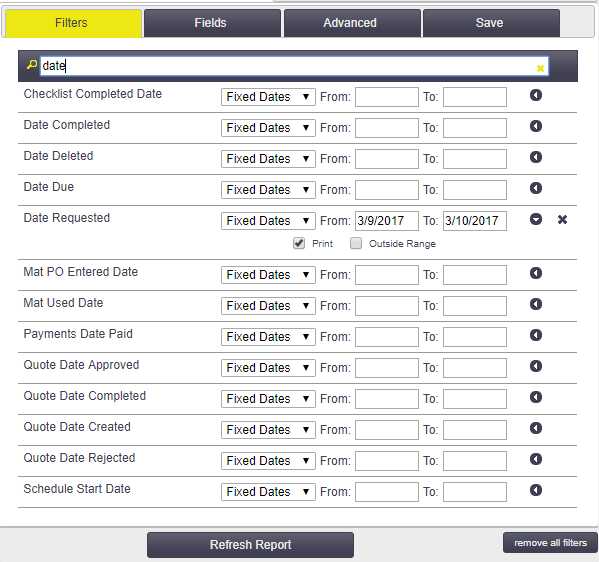
Use filters to display only the information you need. Each report has its own set of filters based on the fields available. You can only filter on information that appears in the report. If the field doesn't exist in the report, then you can't filter on that field. See Apply filters, below. |
 |
 |
Fields
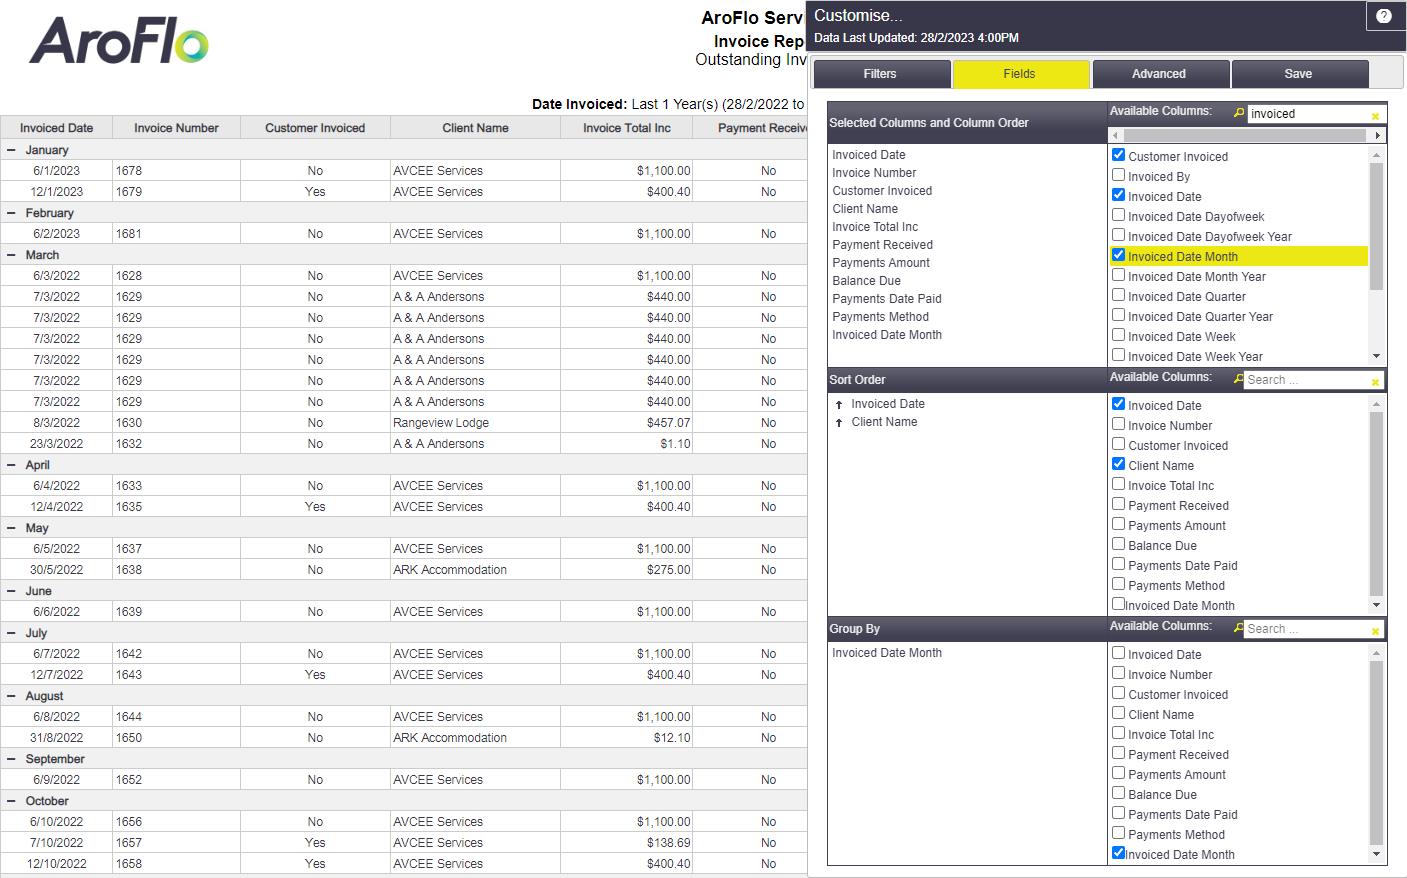
The Fields tab is broken into three sections:
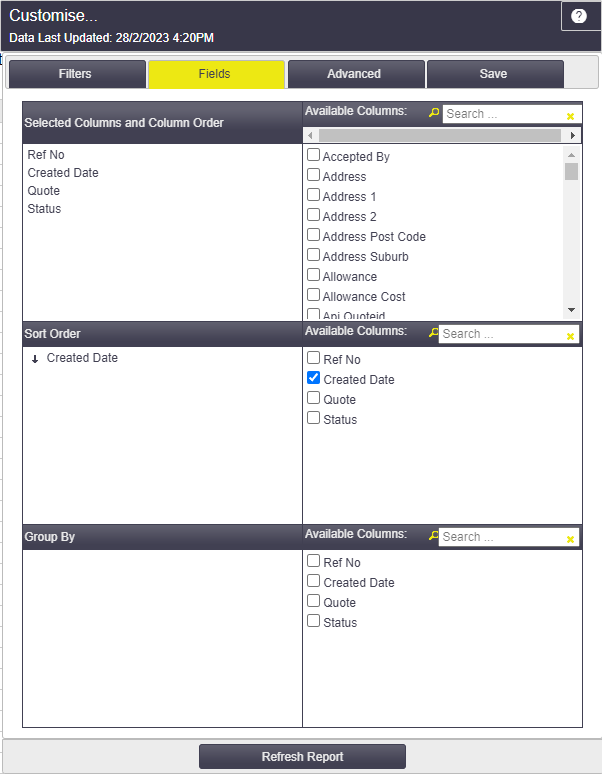
- Selected Columns and Column Order - used for adding, removing and sorting columns (field names).
- Sort Order - used for sorting the data in ascending or descending order.
- Group By - used for grouping data by field name.
Advanced
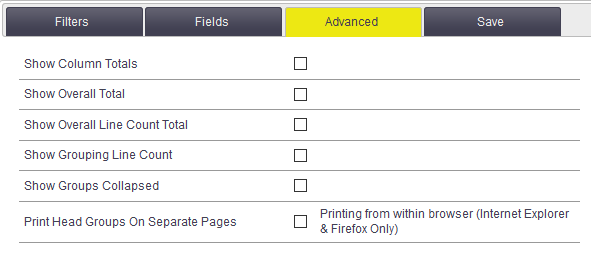
There are a range of advanced options available for report display and printing:
The Show Groups Collapsed option is especially useful when grouping by an extended date field (e.g. Date Week Year, Date Month Year, Year Quarter), as it allows you to see total values for a specified period at a glance. For a graphical representation of the grouped data, use the chart options at the top of the report. |
 |
 |
Save
Once you've created a report, you can save it as a custom report for future use:
- Save - used for saving your existing custom report. This option will not be available if you have customised one of the standard reports.
- Save As ... - used for saving a copy of your current report under a different name. This option is available if you have modified one of the standard reports.
- When using the Customise menu, remember to click Refresh Report (at the bottom of the Customise menu) to update your customised report with the changes you have made.
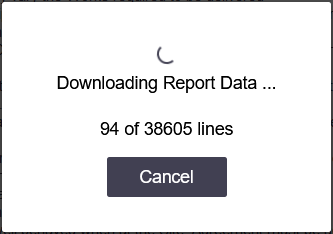
- If your report has too much information or if you've forgotten to include some fields, click Cancel while the report is generating, and then make your refinements before refreshing again.
Show me
Sort Custom Reports
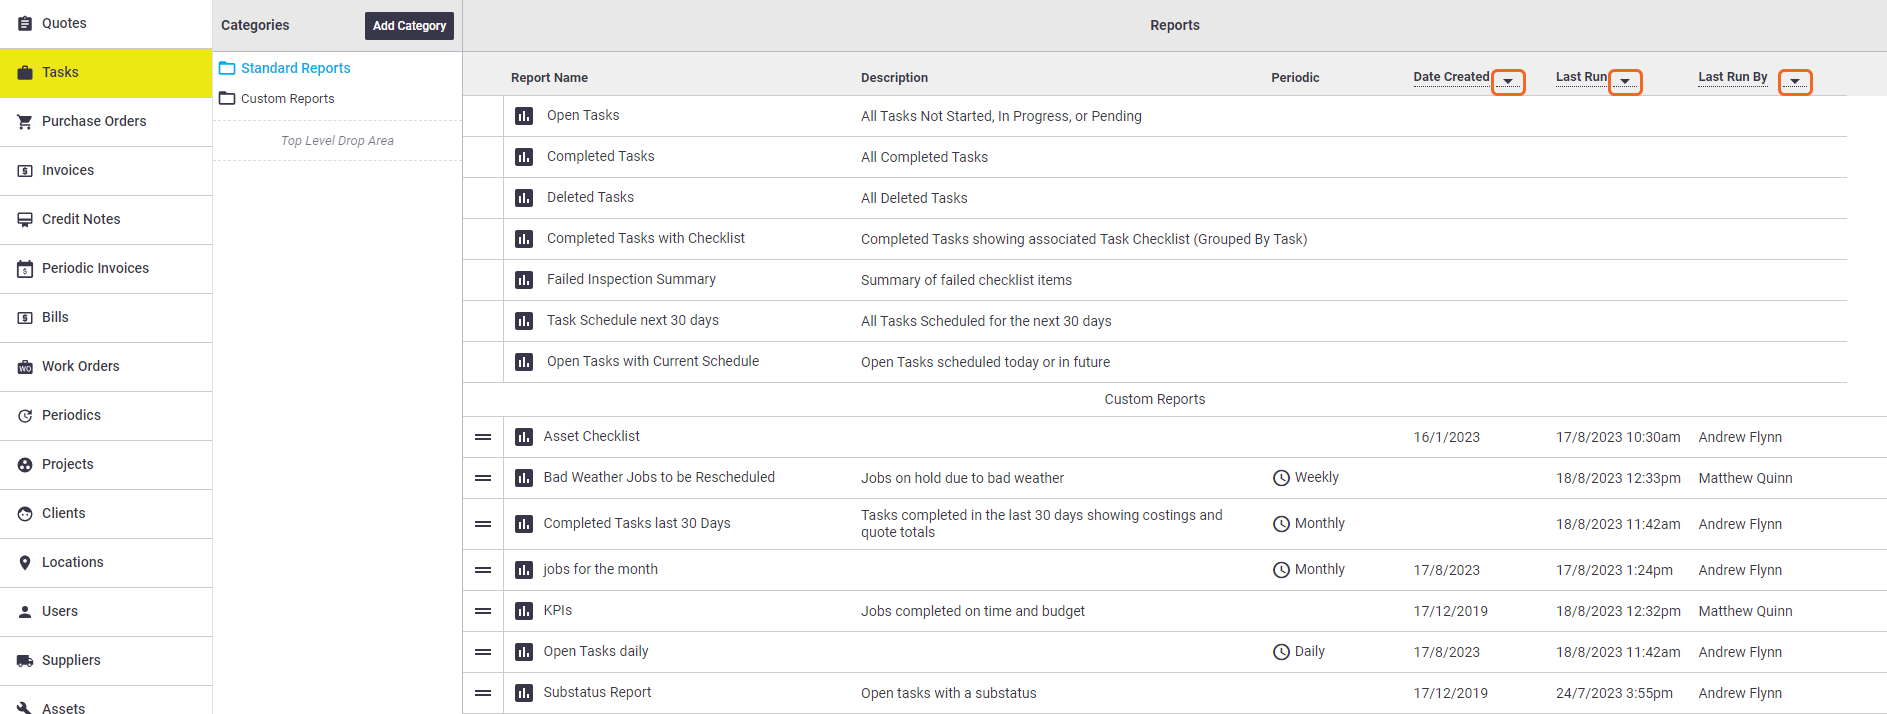
You can sort your custom reports list by creation date, the date the report was last run, and by who it was last run by. Just click the arrow beside Date Created, Last Run, or Last Run By.
- You can also manually sort the default order of your custom reports by dragging the
 (two lines button)
 - The Last Run and Last Run By includes when the report was last opened but also when it was last exported (e.g. to Microsoft Word).
Apply filters
|
You can only filter on information that appears in the report. If the field doesn't exist in the report, then you are unable to set a filter on that field. From/To date filters provide advanced options which can be accessed by clicking
All selection lists provide a Select All option but only some have an option to select None. If this option is available, it will be the first option in the list.
Custom Fields Task, Asset, and Client reports include the option to filter by custom fields. Custom fields using the ‘Checkbox’, ‘Radio’ or ‘Select’ field types appear at the bottom of the Filters tab. |
 |
 |
Add or remove fields
|
The Selected Columns and Column Order section lets you select the fields you want to include in your report and their display order.
Looking for custom fields? If you're using custom fields, you can include these in your reports by typing 'cf' in the Available Columns field. Certain report types have applicable custom fields belonging to other areas, for example, Purchase Order reports contain Task (Cf [xxx]), Supplier (Cfsup [xxx]), Project (Cfproj [xxx]) as well as Purchase Order (Cfpo [xxx]) custom fields. Show me Occasionally when moving fields in the display order, the field can become stuck to the mouse pointer. If this happens, move the field to your desired position and click the left mouse button again. The field will now release from the mouse. |
 |
 |
Change the sort order of fields
The Sort Order section allows you to set how your data will be sorted in your report.
- To add, remove or move a field, refer to the instructions above.
- To change the sort order of a field from ascending to descending or vice versa, click
 or
or  (up or down arrow icons).
Add field groups
The Group By section allows you to set how your data will be grouped in your report. To add, remove or move a field, refer to the instructions above.
Fields of note
There are some fields for which it's not quite apparent what data they will retrieve and how you might best use them. Below is a list of these fields; we'll update this list as we add new fields to the reporting area.
Report Area |
Field |
Description |
|---|---|---|
| TASK | KPI_TODAY_VS_REQUIRED | KPI field: Numeric value to show how many days left to meet Due Date |
| TASK | KPI_TODAY_VS_REQUIRED_EX_WEEKENDS | KPI field: Numeric value to show how many days left to meet Due Date, excluding weekends |
| TASK | TASK_INVOICES_TOTAL_EX | Calculated field for the total of all invoices raised against the task |
Save your report
|
Once you've created the custom report you need, instead of having to recreate it each time, you can save it for future use.
|
 |
 |
Report Restrictions
You can also create report restrictions from here so that only certain users, permissions, and/or clients will be able to view them. For more information, please see Report Restrictions.
Save as Periodic Report
|
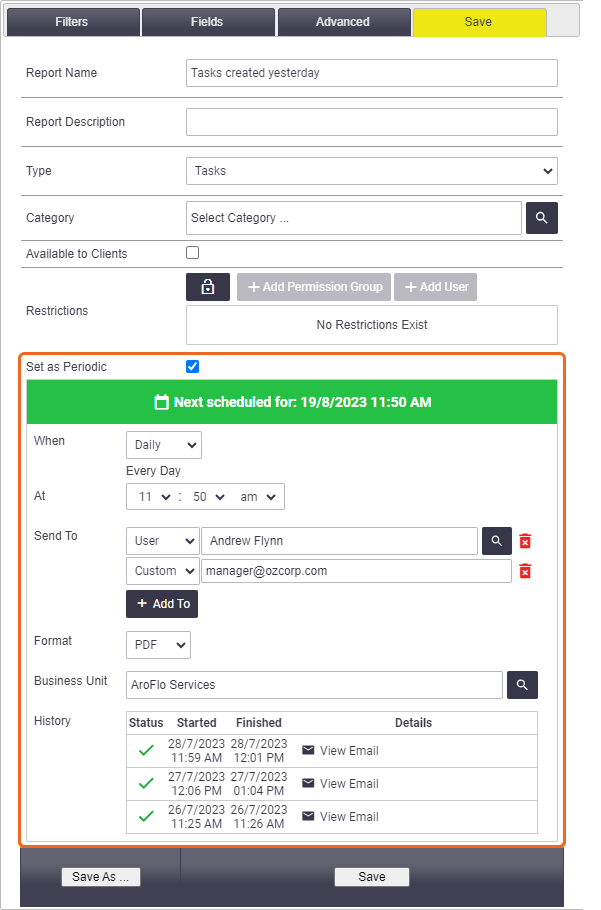
You can also schedule reports to be emailed at a day and time of your choosing: Scenarios You might want a report of tasks created for the last week, scheduled for the past day, or completed in the last month.
This will only work if already dealing with a custom report. If wanting to do this for a standard report, you'll first need to Save As... to save your report as a custom report. Once you've saved your report, you'll see when the report is next scheduled to run, depending on the options you've chosen. In addition, the reports list will also tell you the report is periodic and tell you the frequency (see above image).
|
 |
||||||||||||||
 |
 (arrow icon).